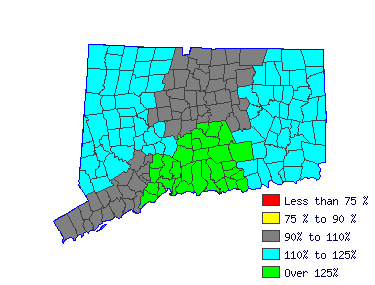
| Mean Wage History |
| Year | This Occupation | Compared to
Occupational Group | Difference |
| Current | $68495.62 | | $59890.07 |
| $8605.55 |
| 2014 | $68162.58 | +.5% | $59598.87 |
+.5% | $8563.71 |
| 2013 | $66885.92 | +1.9% | $58482.60 |
+1.9% | $8403.31 |
| 2012 | $65609.26 | +1.9% | $57366.34 |
+1.9% | $8242.92 |
| 2011 | $64332.60 | +2.0% | $56250.07 |
+2.0% | $8082.52 |
| 2010 | $63333.47 | +1.6% | $55376.47 |
+1.6% | $7957.00 |
| 2009 | $62223.33 | +1.8% | $54405.81 |
+1.8% | $7817.52 |
| 2008 | $61557.25 | +1.1% | $53823.41 |
+1.1% | $7733.84 |
| 2007 | $59725.52 | +3.1% | $52221.81 |
+3.1% | $7503.70 |
| 2006 | $57727.26 | +3.5% | $50474.61 |
+3.5% | $7252.65 |
| Year | This Occupation | Compared to
All Occupations | Difference |
| Current | $68495.62 | | $63821.30 |
| $4674.32 |
| 2014 | $68162.58 | +.5% | $63300.73 |
+.8% | $4861.84 |
| 2013 | $66885.92 | +1.9% | $61947.27 |
+2.2% | $4938.65 |
| 2012 | $65609.26 | +1.9% | $60697.91 |
+2.1% | $4911.35 |
| 2011 | $64332.60 | +2.0% | $59656.78 |
+1.7% | $4675.82 |
| 2010 | $63333.47 | +1.6% | $58719.76 |
+1.6% | $4613.71 |
| 2009 | $62223.33 | +1.8% | $57730.69 |
+1.7% | $4492.64 |
| 2008 | $61557.25 | +1.1% | $56949.84 |
+1.4% | $4607.41 |
| 2007 | $59725.52 | +3.1% | $55492.26 |
+2.6% | $4233.26 |
| 2006 | $57727.26 | +3.5% | $53722.33 |
+3.3% | $4004.93 |
|
Reference Date: 1st Quarter 2015 |
State of Connecticut Department of Labor Office of Research
200 Folly Brook Boulevard Wethersfield, CT 06109
Phone: 860-263-6285 |

| | | | |
| Top Areas For This Occupation |
|
|
|
 |


